Chart.js
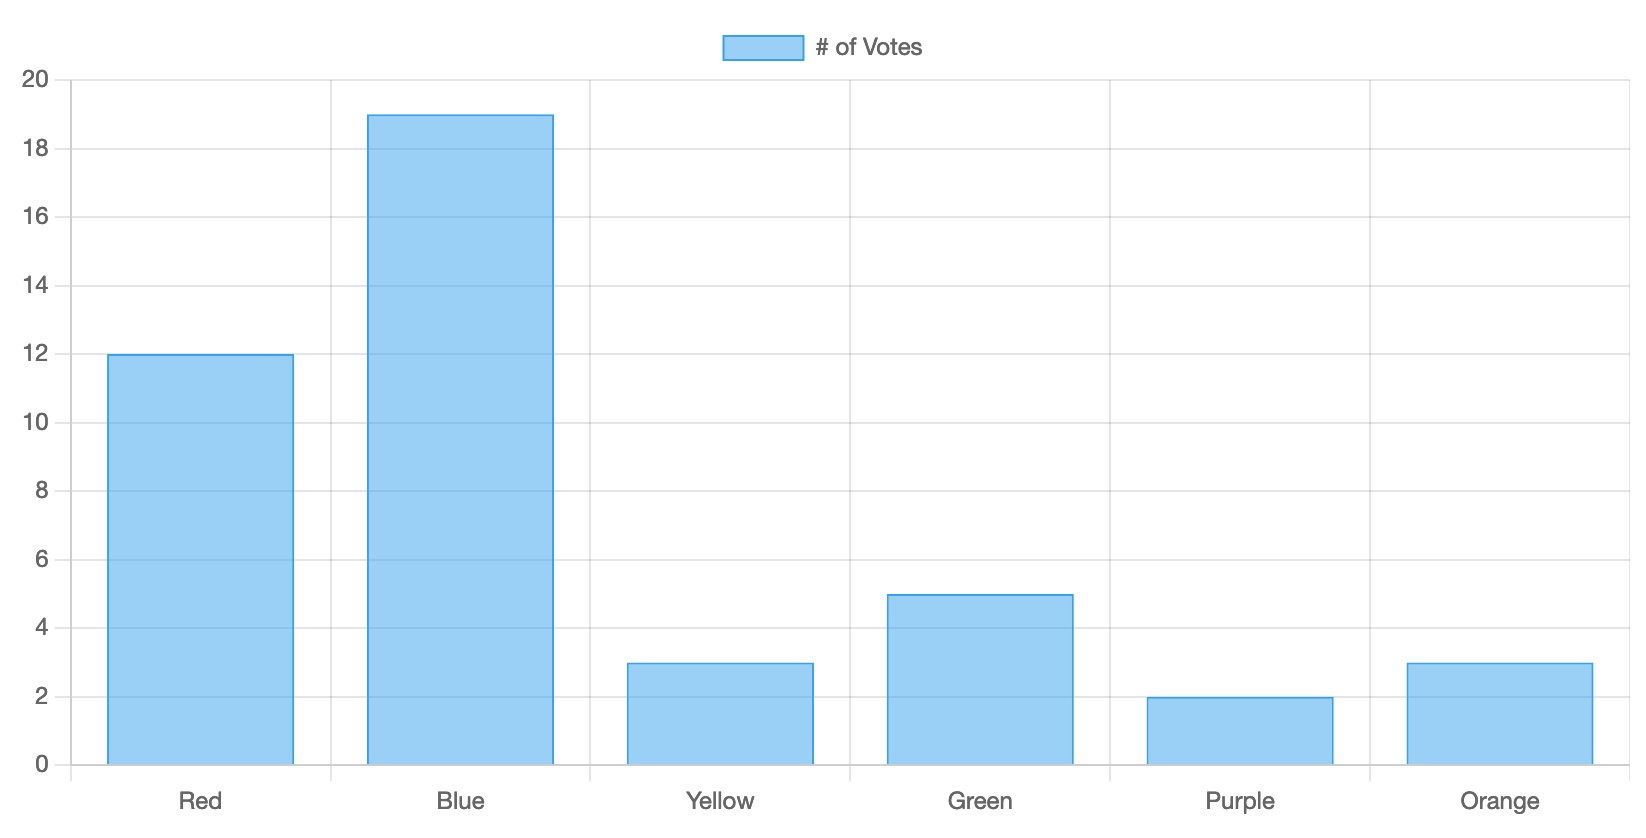
In this section we will reproduce the same chart as the Getting Started section of the Chart.js docs.
After installing Axis and Chart.js, we can instantiate a chart object and pass it to a view on a controller:
use Axis\Chart;

class ExampleController extends Controller
{
    public function __invoke(): View
    {
        $chart = Chart::chartjs()
            ->column()
            ->labels(['Red', 'Blue', 'Yellow', 'Green', 'Purple', 'Orange'])
            ->series('# of Votes', [12, 19, 3, 5, 2, 3], ['borderWidth' => 1])
            ->options(['scales' => [
                'y' => ['beginAtZero' => true],
            ]]);

        return view('example.chart', compact('chart'));
    }
}
On the blade file:
<section>
    <div>{{ $chart }}</div>
</section>
You should get a chart like this:

Pretty simple, right?
Last updated on